Quant Analyzer Report
S&P 500
Source: MT5Report| Symbol | .US500Cash | Period | unknown : 12.01.2022 - 16.12.2022 |
|---|---|---|---|
| Initial deposit | 1500.0 | ||
| Parameters | - | ||
Total Profit
95.18 %
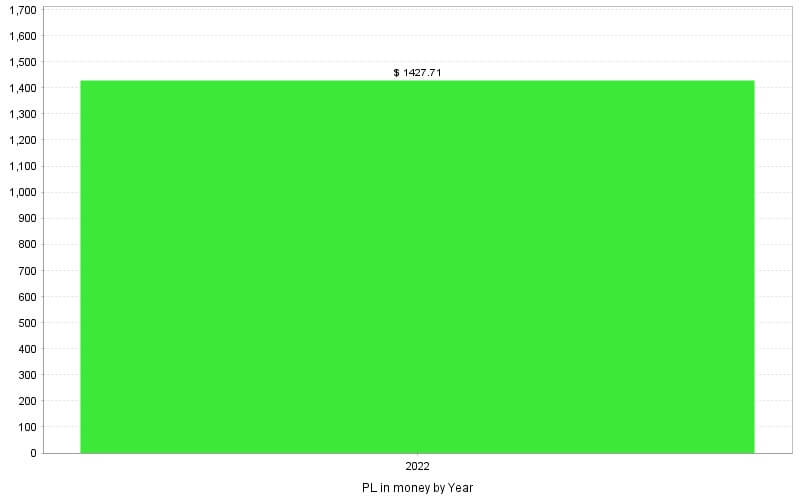
Profit in money
$ 1427.71
Yrly Avg profit
95.08 %
Yrly Avg % ret
95.08 %
CAGR
95.18 %
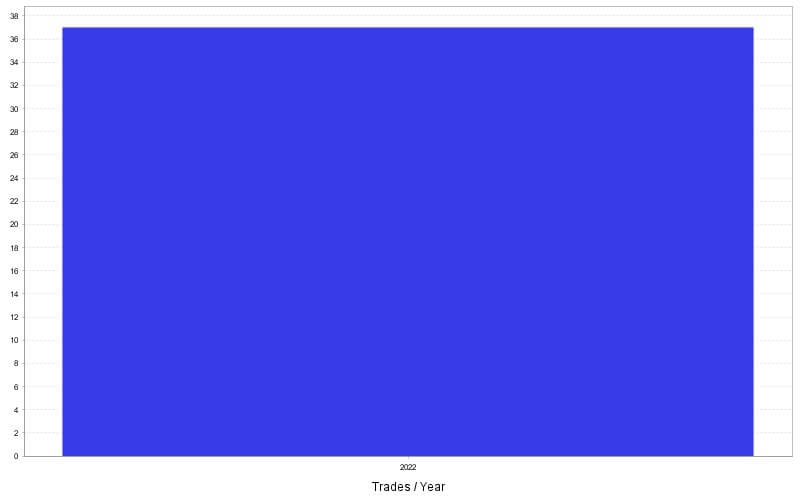
# of trades
37
Sharpe ratio
0.23
Profit factor
2.19
Return / DD ratio
5.53
Winning %
21.62 %
Drawdown
17.2 %
% Drawdown
17.2 %
Daily Avg profit
0.99 %
Mthly Avg profit
7.93 %
Average trade
38.59 %
Annual% / Max DD%
5.53
R Expectancy
0.93 R
R Exp score
34.32 R
SQN
1.29
SQN score
0.18
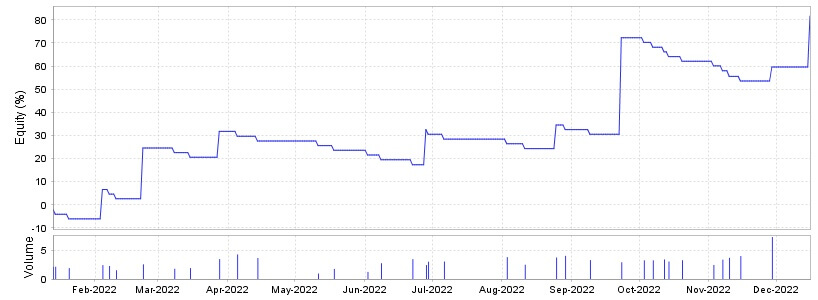
Monthly Performance (%)
| Year | Jan | Feb | Mar | Apr | May | Jun | Jul | Aug | Sep | Oct | Nov | Dec | YTD |
| 2022 | -6.07 | 30.64 | 7.2 | -4.18 | -4 | 6.93 | -2.11 | 4.12 | 39.71 | -10.14 | -2.53 | 22.02 | 81.61 |
Stats
Strategy
| Wins/Losses Ratio | 0.28 | Payout Ratio (Avg Win/Loss) | 7.92 | Average # of Bars in Trade | 0 |
| AHPR | 2.21 | Z-Score | -0.02 | Z-Probability | 50.8 % |
| Expectancy | 2.57 | Deviation | 38.01 % | Exposure | -999999999 % |
| Stagnation in Days | 155 | Stagnation in % | 45.86 % |
Trades
| # of Wins | 8 | # of Losses | 29 | # of Cancelled/Expired | 0 | ||
| Gross Profit | 175.43 % | Gross Loss | -80.25 % | Average Win | 21.93 % | Average Loss | -2.77 % |
| Largest Win | 53.65 % | Largest Loss | -3.8 % | Max Consec Wins | 2 | Max Consec Losses | 9 |
| Avg Consec Wins | 1.14 | Avg Consec Loss | 4.14 | Avg # of Bars in Wins | 0 | Avg # of Bars in Losses | 0 |
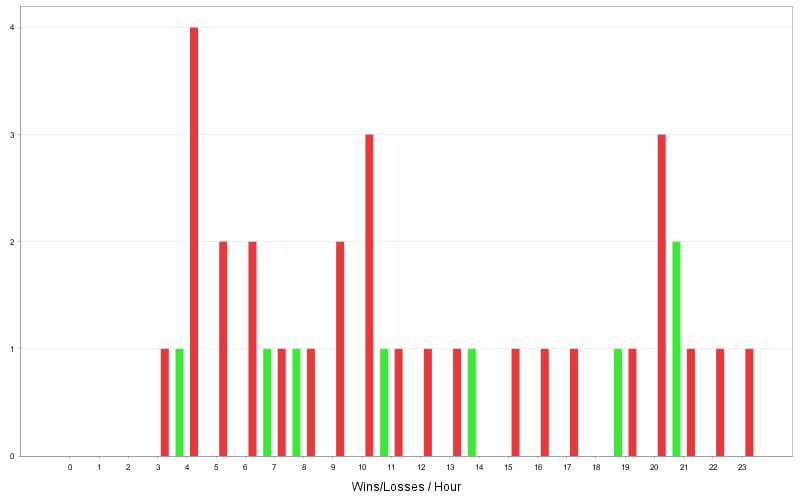
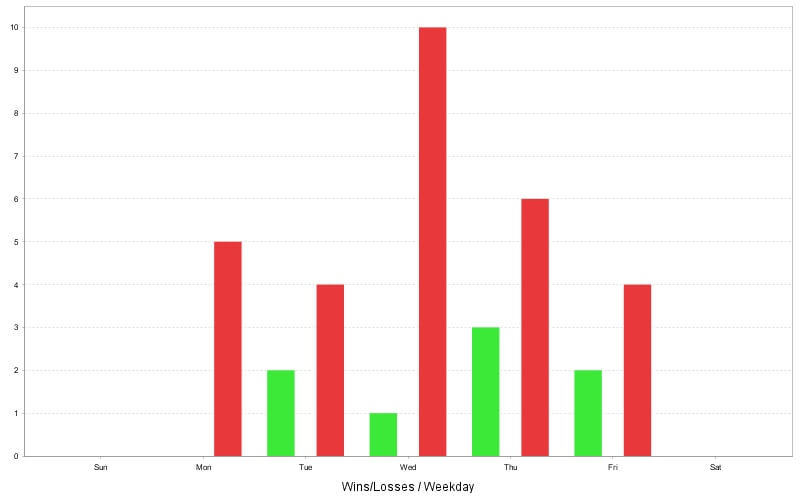
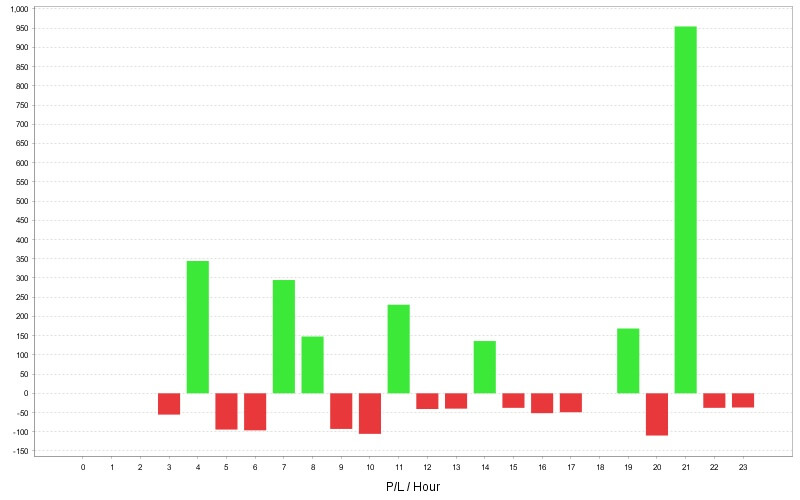
Charts
Click on the chart to see bigger image
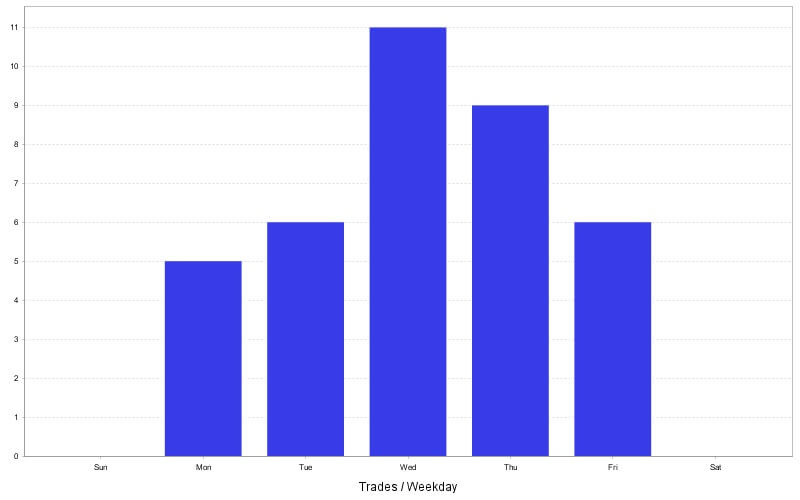

Trades
| Ticket | Type | Open time | Open price | Size | Close time | Close price | Profit/Loss | Comment |
| 2 | Buy | 12.01.2022 11:30:00 | 4718.3 | 2.12 | 13.01.2022 19:15:40 | 4703.8 | -2.05 % | sl 4703.8 |
| 4 | Sell | 14.01.2022 10:04:16 | 4662.4 | 2.14 | 14.01.2022 11:35:05 | 4676.3 | -2.02 % | sl 4676.1 |
| 6 | Sell | 19.01.2022 20:30:05 | 4582.7 | 1.9 | 20.01.2022 17:52:40 | 4597.8 | -1.99 % | sl 4597.8 |
| 8 | Sell | 03.02.2022 08:03:25 | 4541.1 | 2.42 | 04.02.2022 13:21:26 | 4467 | 12.71 % | |
| 10 | Sell | 07.02.2022 08:35:14 | 4495.2 | 2.27 | 07.02.2022 09:13:27 | 4509.1 | -1.98 % | sl 4509.1 |
| 12 | Buy | 10.02.2022 19:22:39 | 4574.1 | 1.52 | 10.02.2022 19:45:40 | 4553.3 | -2.03 % | sl 4553.3 |
| 14 | Sell | 18.02.2022 07:59:04 | 4406.2 | 2.56 | 22.02.2022 03:23:03 | 4275.3 | 21.95 % | |
| 16 | Sell | 08.03.2022 04:40:37 | 4209.3 | 1.79 | 08.03.2022 14:10:39 | 4230 | -1.99 % | sl 4230.0 |
| 18 | Sell | 11.03.2022 21:00:02 | 4239.8 | 1.9 | 15.03.2022 21:17:30 | 4259.1 | -2.01 % | sl 4259.0 |
| 20 | Buy | 24.03.2022 19:00:20 | 4496.6 | 3.47 | 28.03.2022 14:19:42 | 4554.3 | 11.2 % | tp 4554.2 |
| 22 | Buy | 04.04.2022 20:31:34 | 4572.7 | 4.28 | 05.04.2022 17:15:29 | 4562.8 | -2.13 % | sl 4562.8 |
| 24 | Buy | 14.04.2022 13:00:28 | 4449.7 | 3.66 | 14.04.2022 14:54:34 | 4438.8 | -2.05 % | sl 4438.9 |
| 26 | Sell | 10.05.2022 22:30:17 | 4003.5 | 0.95 | 11.05.2022 11:50:04 | 4043.3 | -1.98 % | sl 4043.3 |
| 28 | Buy | 13.05.2022 10:31:17 | 3972.3 | 1.76 | 18.05.2022 20:12:40 | 3950.9 | -2.02 % | sl 3950.9 |
| 30 | Sell | 01.06.2022 23:00:05 | 4099.9 | 1.24 | 02.06.2022 18:46:20 | 4129.7 | -2.02 % | sl 4129.3 |
| 32 | Buy | 08.06.2022 04:15:06 | 4156.9 | 2.75 | 08.06.2022 06:19:35 | 4143.2 | -2.1 % | sl 4143.2 |
| 34 | Sell | 22.06.2022 15:00:25 | 3714.2 | 3.47 | 22.06.2022 16:28:46 | 3725.1 | -2.15 % | sl 3724.3 |
| 36 | Buy | 24.06.2022 11:03:12 | 3829.7 | 2.43 | 28.06.2022 16:47:18 | 3937.2 | 15.2 % | |
| 38 | Sell | 29.06.2022 05:04:26 | 3825.5 | 3.02 | 29.06.2022 15:01:38 | 3838.6 | -2 % | sl 3838.6 |
| 40 | Buy | 06.07.2022 12:30:05 | 3830.3 | 3.05 | 06.07.2022 14:52:31 | 3816.9 | -2.11 % | sl 3816.9 |
| 42 | Sell | 03.08.2022 10:00:42 | 4100 | 3.81 | 03.08.2022 12:16:28 | 4110 | -2.01 % | sl 4110.0 |
| 44 | Buy | 11.08.2022 20:15:42 | 4236.4 | 2.49 | 11.08.2022 21:12:36 | 4220.8 | -2.09 % | sl 4220.8 |
| 46 | Buy | 24.08.2022 21:59:40 | 4140.7 | 3.75 | 25.08.2022 22:46:15 | 4190.4 | 10.23 % | tp 4190.4 |
| 48 | Sell | 29.08.2022 07:49:26 | 4022.7 | 4.04 | 29.08.2022 09:57:27 | 4032.7 | -2.01 % | sl 4032.6 |
| 50 | Sell | 31.08.2022 09:30:23 | 4007.2 | 3.3 | 09.09.2022 03:32:35 | 4019.2 | -2.01 % | sl 4019.1 |
| 52 | Sell | 13.09.2022 21:00:45 | 3987.8 | 2.92 | 23.09.2022 13:45:36 | 3712.2 | 41.73 % | tp 3712.2 |
| 54 | Sell | 03.10.2022 05:35:05 | 3580.8 | 3.26 | 03.10.2022 08:52:37 | 3597.6 | -2 % | sl 3597.6 |
| 56 | Buy | 04.10.2022 03:00:00 | 3689.7 | 3.26 | 07.10.2022 16:50:41 | 3672.7 | -2.07 % | sl 3672.7 |
| 58 | Sell | 12.10.2022 04:30:04 | 3595.9 | 3.41 | 12.10.2022 07:04:39 | 3611.3 | -2 % | sl 3611.3 |
| 60 | Buy | 14.10.2022 09:28:31 | 3699.8 | 3.05 | 14.10.2022 10:21:40 | 3682.4 | -2.06 % | sl 3682.4 |
| 62 | Sell | 20.10.2022 06:32:31 | 3675 | 3.27 | 20.10.2022 07:19:19 | 3690.4 | -2 % | sl 3690.4 |
| 64 | Sell | 03.11.2022 17:30:41 | 3726.5 | 2.45 | 03.11.2022 18:50:38 | 3746.6 | -2 % | sl 3746.6 |
| 66 | Buy | 07.11.2022 16:30:27 | 3791 | 3.38 | 07.11.2022 16:36:59 | 3775.7 | -2.14 % | sl 3776.3 |
| 68 | Sell | 10.11.2022 04:06:03 | 3756.1 | 3.7 | 10.11.2022 15:30:19 | 3771.5 | -2.41 % | sl 3768.9 |
| 70 | Sell | 15.11.2022 06:57:05 | 3977.7 | 4 | 15.11.2022 09:20:30 | 3989.2 | -1.99 % | sl 3989.2 |
| 72 | Sell | 29.11.2022 14:31:03 | 3978.5 | 7.31 | 29.11.2022 16:55:43 | 3959.9 | 6.01 % | |
| 74 | Sell | 15.12.2022 04:11:00 | 4002.3 | 3.86 | 16.12.2022 10:30:05 | 3865.4 | 22.02 % | tp 3865.4 |